
Windows, Sheets, Projections and Overlays
The display of data is based on some fundamental concepts which, once grasped, will make the task of formatting easy.
Also see 3D Data View Hierarchy.
Principles
The following principles apply to all data, regardless of how it is displayed:
-
Data must be loaded into memory before it can be viewed in a display window.
-
When a file is loaded into memory the data becomes an object, and separate files become separate objects.
-
If an object has a spatial context (i.e. it has form and a specific location in space) it is considered a 3D object (points, strings, wireframes and so on).
-
If data has no visual elements, it is referred to as a table.
-
-
3D objects are represented in display windows by overlays. A single 3D object can be represented by many overlays but a single overlay can only represent one 3D object.
-
When 3D object is created , a default overlay is automatically created in each of the display views. You can control the settings for this default formatting using 3D display templates. See 3D Display Templates.
-
In the Plots window, data is displayed on a sheet and each sheet can contain one or more projections (displays of 3D data).
-
A Plot window projection can either be of the 2D or 3D variety. See 3D Overlay Groups.
-
2D Plot window projections represent a legacy approach to data display in hardcopy reports, although this approach sometimes works better for reports containing CAD-style data.
-
3D Plot window projections can be considered mini 3D windows, embedded in a plot sheet. These feature additional rendering, closer to that found in the 3D windows.
-
Windows
In Studio products, data is displayed in a "window". There are multiple window types used in Studio products to display data, including:
-
3D windows — embedded or external, linked or independent). One or more 3D windows can be displayed. See 3D Window Visualization.
-
Managed task windows — these are like general 3D windows (see above) but are dedicated to a particular task involving 3D data. For example, the Auto Design window in Studio OP focusses on displaying the inputs and results of automated pit or dump design.
-
The Plots window — featuring the richest hierarchy of display elements, the Plots window lets you present multiple views (known as 'projections') of data alongside other static and dynamic elements. Perfect for hardcopy reporting. See The Plots Window.
-
...and there are more to display non-3D, tabular data, including the Logs window, the Reports window and the Files window.
Sheets
Sheets are independent report displays found in the Plots window. Each sheet is represented by a tab at the bottom of the window, for example:

Projections
A plot sheet can contain one or more projections. A projection is a representation of 3D data and is comprised of (typically) a set of overlays that present a loaded data object's geometry.
Plot sheets can either be of the 2D or 3D variety. The 2D form represents Studio's legacy offering, but can be useful when presenting CAD-style data. More recently, 3D projections were introduced that can present data in the same way as a 3D window, with very similar formatting options, for example:
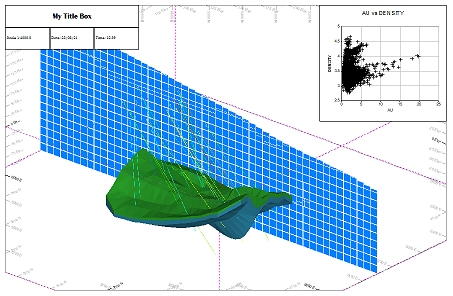
A plot sheet's 3D overlay showing multiple object overlays and overlaid Plot Item Library elements
Overlays
An overlay is a representation of 3D data. A data object can be represented by one or more overlays, and multiple overlays of the same type can be displayed concurrently. For example, in a 3D window, a wireframe can be displayed as both a clipped 3D surface and an intersection, which can help to highlight the clipped edge of the data:

2 wireframe overlays of the same underlying data object shown in a 3D window
Related topics and activities